

Are you wondering about lead source tracking? Once there is some traffic on a website, how do you figure out where it is coming from? More importantly, what to do with that information?
The easiest way to track website traffic and track a lead source is to use Google Analytics or alternative a plugin with enhanced features that can gather and organize information to make it user-friendly and more insightful.
Let’s see how it is going to work.

Contents
WHAT IS LEAD SOURCE TRACKING?
Lead source tracking is the process of finding out where your traffic and leads come from. Finding out where traffic is coming from is not enough to have enough information to develop a more effective marketing plan.
One should be able to see:
- Where the traffic comes from ( Social media, organic traffic, referrals, etc.)
- Which pages get the most traffic
- What is the percentage of that traffic converting into a lead ( either subscribing or purchasing something)
- What page converts the most traffic
- Which forms convert the most traffic
- What are the most downloaded files
- What ads got better results
- And more
As many details one can gather, better are the chances to create a killer marketing plan to increase traffic and leads even more.
Some leads may convert in becoming subscribers, but some are buying and becoming loyal followers or customers. You want to analyze where those leads are coming from.
In other words, connecting to Google Analytics and see traffic reports is not giving a complete picture. For example, you check your analytics and see that your site gets 10.000 people from Pinterest. Sure, it tells you that your Pinterest strategy produces some results, and you should invest more in it.
Analytics can help you gather detailed insights.
HOW TO CHECK YOUR WEBSITE TRAFFIC SOURCE?
Google Analytics will tell you exactly what traffic you are getting and where it comes from. However, Google Analytics is not always so immediate to set up and understand. If you want to track more events (such as file downloads, scroll depth, clicks, video engagement, etc.), you have to deal with coding and a more complex setup.
It is way easier to use a plugin that connects to Google Analytics and does all the heavy work and complicated setup automatically for you. The best plugin to use is MonsterInsights.
MonsterInsight gathers data from Google Analytics and presents it to you in a very digestible form. It allows you to track events and track traffic on each page with various types of metrics available (such as scroll tracking, popular posts, form conversion, file download, link tracking, etc.)
The best part is that you can see all of it from your WordPress site directly.
MonsterInsight is free to use for the most basics reports. Otherwise, you can see what plan best suits your site.
What are the most common reports you can get from MonsterInsight?
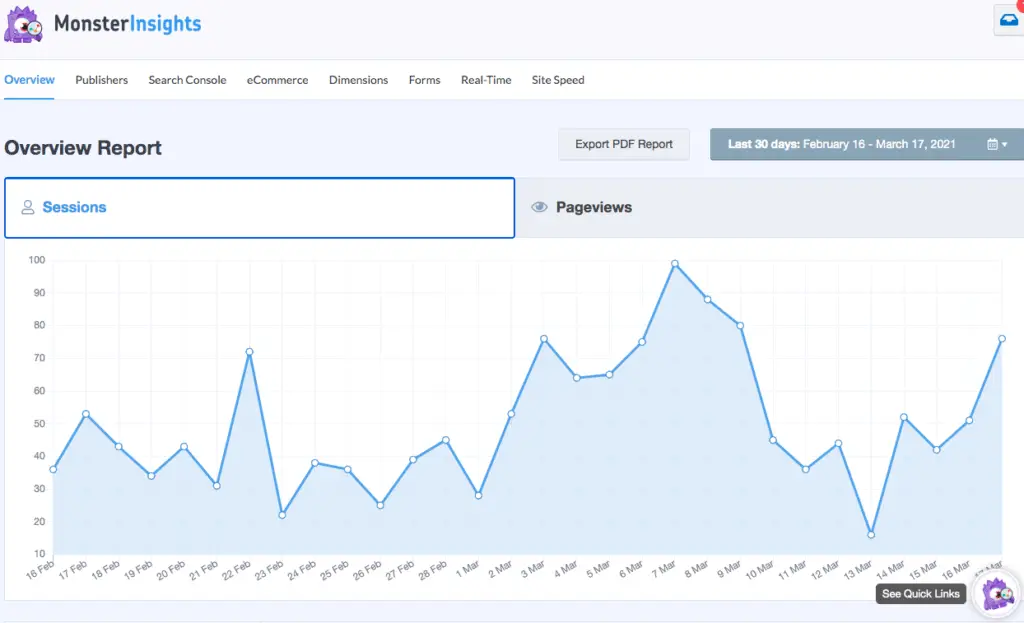
OVERVIEW REPORT
This is the report you see when you first login into your WordPress dashboard. It is the overall traffic to your site.
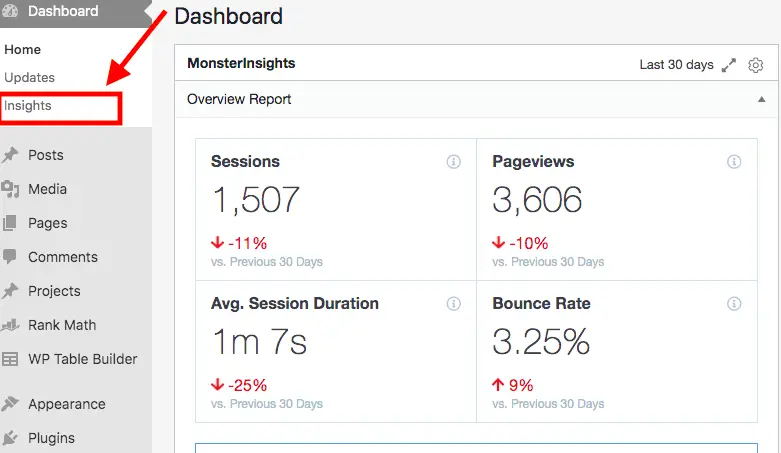
If you click on Insights, you can see the graph (like the one shown above) and many other types of reports.
DEVICE BREAKDOWN
Once you are into Insights, you can discover many other types of reports. One of these is the device breakdown. It shows from which device your traffic is coming from:
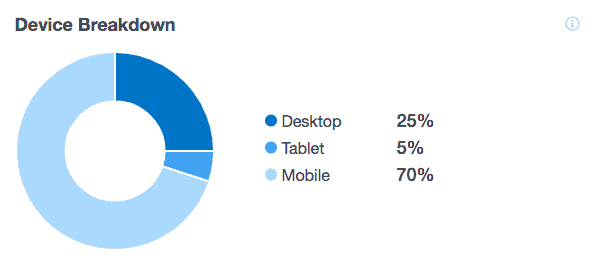
For example, if traffic is coming mostly from mobile, the website should be as mobile-friendly as possible in terms of speed and other factors that can influence user experience.
TOP REFERRING COUNTRIES
Scrolling down comes the next report. You can see from which countries your traffic is coming from:
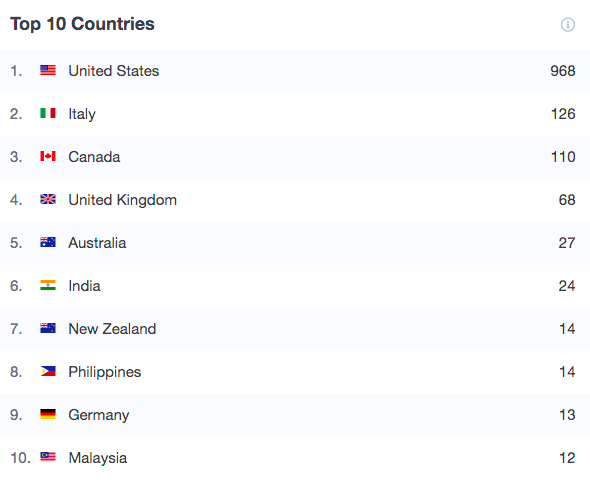
The report allows seeing the top 10 countries referring traffic. If you are targeting US traffic, and your traffic is not coming from the US, it is clear that you have to take action and figure out the content that will attract that type of traffic. Or adjust your content to the traffic you already have to make the most of it.
REFERRAL REPORT
The next report will show you which other site is bringing you traffic. The report shows the first 10 items.
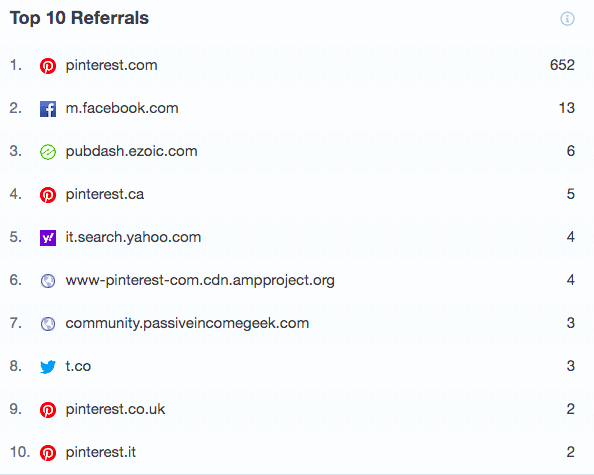
It is a significant report, as it will tell you where you have to continue to work to get even more traffic. One can analyze the actions taken to drive traffic from those sites and develop a pattern or a plan for the future.
TOP PAGES/POSTS
Always in the same page, you can see a summary of the top traffic pages. You can see at once the entrance points of your site. You could optimize successful post for monetization, since they get the most traffic, and improve the one that gets less traffic.
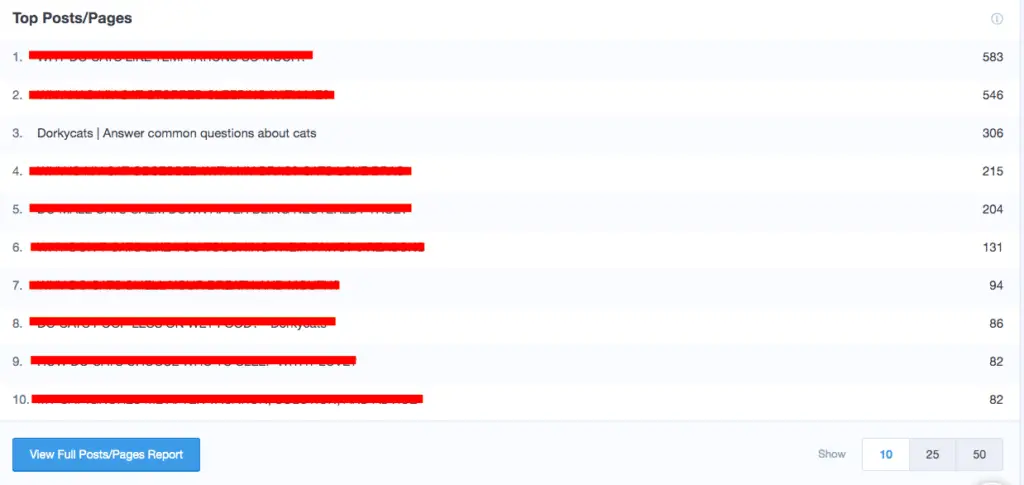
There are many ideas one can get on such a report. Additionally, you can see up to the first 50 posts.
SEARCH CONSOLE REPORT
The next report is about the keywords that bring you traffic organically. Are all those keywords that are ranking in Google and make it possible for visitors to find your site.
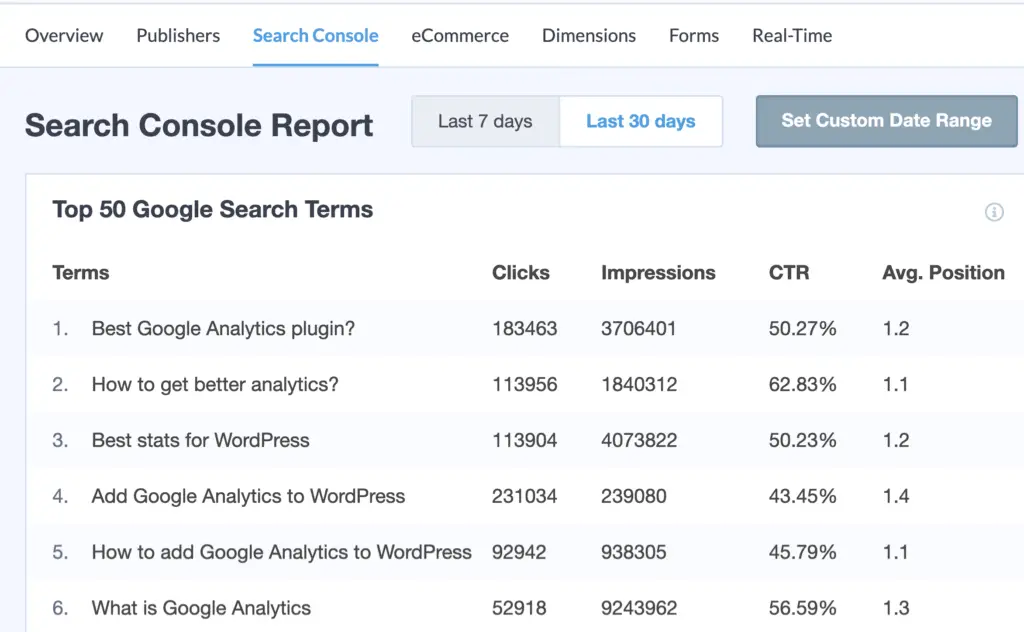
You can see up to 50 keywords, along with clicks, impressions, CTR, and average position. Such a report can give you ideas of what type of keyword research you can do to find more lucrative keywords, or take the top 20 keywords and related articles and optimize them to rank higher.
E-COMMERCE REPORT
If you have a store, it is possible to figure out where your sales are coming from. It is a way to figure out your most converting traffic. It shows the top 10 referring sites and relative sales.
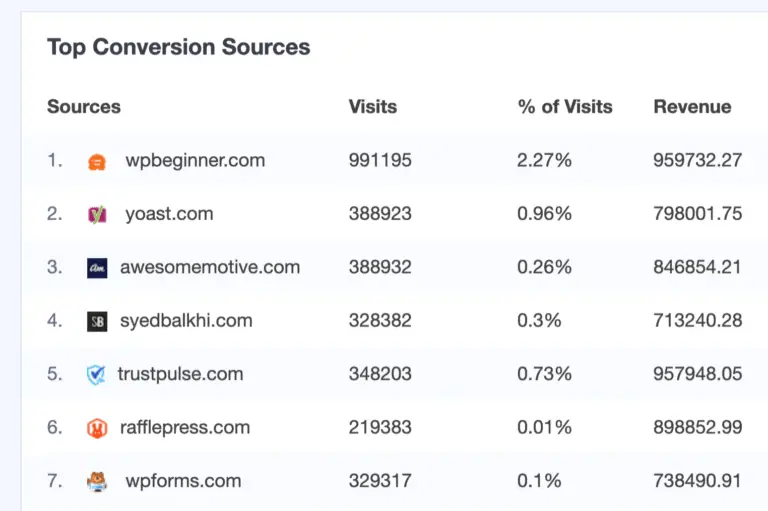
One can figure out partnerships or special deals to display on referring sites. Or come up with more marketing strategies.
HOW TO FIND TRAFFIC SOURCES IN GOOGLE ANALYTICS
If you want to check your website traffic using Google Analytics, there are several useful reports to look at.
The first one is the traffic sources. To check it, once into Google Analytics, search for the menu Acquisition the All Traffic and then Overview:
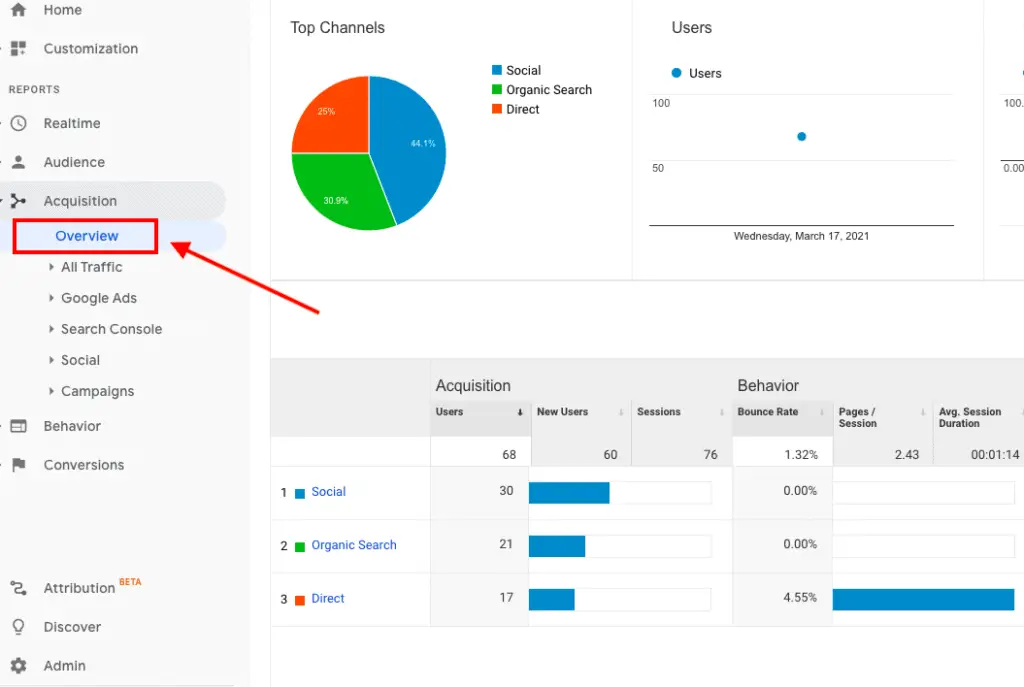
In this menu you can see all the traffic sources to you site, where you are getting traffic from social media, organic traffic, referrals from other sites, or direct traffic.
If you want to get more details, always in the same menu, go on All Traffic and then Source/Medium:
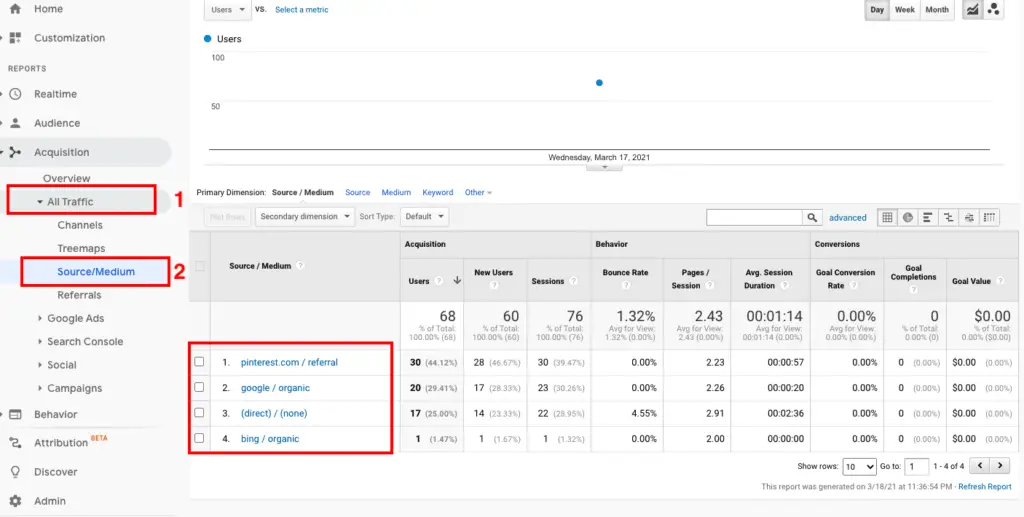
It is possible to the details on which social media is driving traffic, and which search engine.
There are tons of different types of reports in Google Analytics under the various menus. For examples, if you go to Behavior, then Site Content, and then All Pages, you can see all the pages that drive traffic to your site:
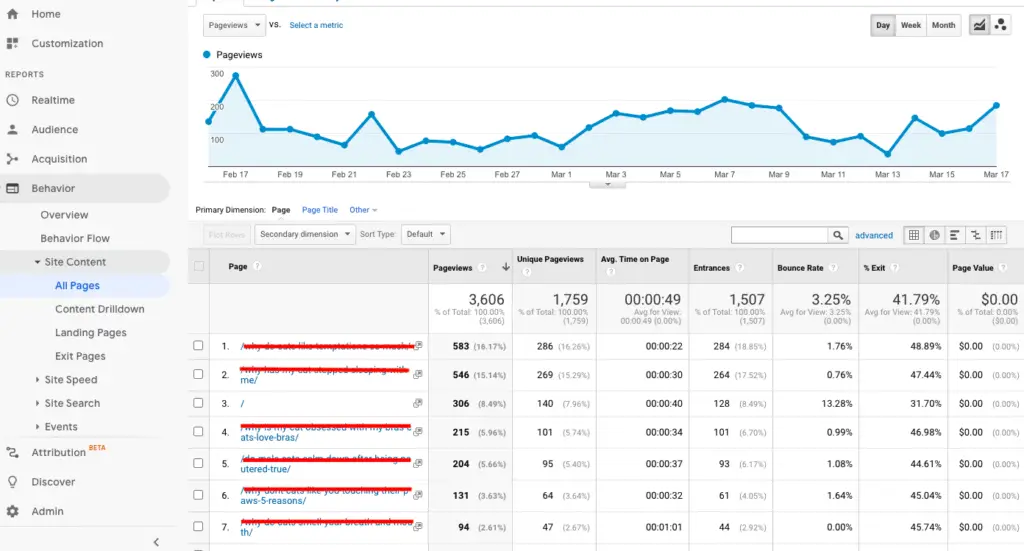
Not only you can see how many page views for a single post, but you can see other informations line how long they have been on the page and the bounce rate.
On other menus, you can find the traffic summary for a given time on your entire website; you can see real-time traffic, which pages are the ones losing the most traffic ( exit rate), and so many other things.
It can be a bit complex to navigate Google Analytics menus. This is why using a plugin to simplify the process can make things easier.
WHY TRACK A WEBSITE TRAFFIC SOURCE?
It is evident that knowing where the traffic is coming from means knowing where to continue to invest energy to get even more traffic. But, it is reductive to use only analytics only for this. So, how to use analytics to come up with a good marketing plan?
Here some example of what you can do by carefully studying traffic source reports.
Improve Rankings
Find the top 10-20 ranking articles, and optimize them to get on a higher position. For example, you find an article that gets 300 visitors per month, and it is positioned at number 11 in Google.
Analyzing your article against the competition, you find that the first 10 articles have only 1200 words and are not complete. Looking at your article, you see that you wrote 900 words and can improve many sections to answer all questions completely.
Result: add 500 words, do better research and answer all questions on the article’s topic. The article moved to position five after some time, and it gets 600 visitors per month.
Reduce Bounce Rate
Find the top 10-20 articles with the highest bounce rate. Analyze them to figure why people are going off your site when they read those articles. Maybe they are not appropriately formatted with bullet points, pictures, and correct subheadings.
If there are too many long blocks of text, people may become bored and leave. Or maybe there is some other reason like missing internal links to keep visitors more on-site.
Result: the articles were reviewed and optimized, the bounce rate decreased by 10%, and visitors stayed on site 40 seconds longer than the previous month.
Improve Marketing Strategy
For example, a site gets 2000 people per months from Pinterest. Google Analytics let you see which pins are generating clicks. Therefore, one could re-pin them and share them around and get even more visitors. Not to mention, increase pin creation and scheduling.
Result: by re-sharing successful pins and increasing pin creation, Pinterest traffic raised by 10%.
Those are only a few examples. There are tons of other things you can figure out through analytics.
CONCLUSION
Now you see the importance of tracking website traffic and what you can do with the information. If you have any questions, leave them in the comments below.n